Debugging Kubernetes (using GoLand IDE)
Sat, Mar 17, 2018Many of us got used to the fmt.Printf debugging. It’s an okay way to print a variable if you suspect it’s wrong.
However, while this can work on the smaller project, this is almost impossible for big projects,
whose structs have numerous fields, and the logic is spanned across many files and packages.
One of those projects is Kubernetes. When I was getting around the project in order to prepare my proposal for Google Summer of Code, one of my tasks were to debug why CRD creation age is set to <invalid>. To debug this, I had to trace down the issue way down to the apimachinery packages.
This is definitely not going to work just by using fmt.Printf("%#v", something).
Luckily, there’re many editors and IDEs with support for delve—Go’s Debugger, and in this post you’re going to see how you can use one of them to debug Kubernetes.
Throughout this post, I’m going to use the GoLand IDE, but this should be applicable for any other editor with delve support, including VS Code and vim(-go). The JetBrains team did really great job creating the first Go IDE, and I find their integration of the delve debugger the best. They’re giving free licenses and discounts to students and open source teams, so make sure to check are you eligible!
Raising Timeouts
Before I even started debugging Kubernetes, I was warned that I have to raise timeouts in apiserver, or all my requests will timeout, so I’ll not get results from the API calls.
These two tweets by @the_sttts were super useful!
Plus this timeout for non-longrunning requests: https://t.co/XXoHnaJFNi.
— Stefan Schimanski (@the_sttts) February 22, 2018
After these 2 changes you can run dlv, drink a coffee and continue debugging 🎉
Default timeouts are 30 seconds for API requests, and 1 minute for non-long running requests. You can choose any value that makes sense for you. Personally, I use 5 minutes for both types of requests, so I have plenty of time to finish debugging.
staging/src/k8s.io/apiserver/pkg/endpoints/handlers/rest.go — Line 324:
...
func parseTimeout(str string) time.Duration {
	if str != "" {
		timeout, err := time.ParseDuration(str)
		if err == nil {
			return timeout
		}
		glog.Errorf("Failed to parse %q: %v", str, err)
	}
	return 5 * time.Minute // Line 324
}
staging/src/k8s.io/apiserver/pkg/server/config.go — Line 263:
...
		MaxRequestsInFlight:          400,
		MaxMutatingRequestsInFlight:  200,
		RequestTimeout:               time.Duration(5) * time.Minute, // Line 263
		MinRequestTimeout:            1800,
		EnableAPIResponseCompression: utilfeature.DefaultFeatureGate.Enabled(features.APIResponseCompression),
...
With those changes in place, you don’t have to hurry or worry about timeouts.
Debugging API requests (and responses)
The easiest way to debug API requests is to use integration tests. Kubernetes has integration tests for almost everything, so this shouldn’t be a problem. Even if you don’t find one for your use case, please make it! Kubernetes Community will gladly accept new tests, as they’re ensuring we have more stable platform <3
The API integration tests are usually requiring you to have etcd server running.
Setting Up Local etcd instance
Kubernetes provides a script for installing etcd on your local machine, so we’re going to use it to make it easy.
Run the ./hack/install-etcd.sh and follow the on-screen instructions to finish the installation.
On the end, you’ll be told what lines you need to add to your ~/.bashrc (or the appropriate alternative) to make etcd working.
This script works on Linux and macOS, however, you’re not out of luck if you’re running Windows. In that case, you need to install it manually, by downloading the appropriate etcd release from the Project’s Releases page. Then, you just need to put it somewhere in your PATH to make it accessible by Kubernetes’ integration tests.
Debugging using integration tests
As mentioned above, the most easiest way to get started is to use or make an integration test for your case. Kubernetes already have A LOT of integration tests, so you’ll probably be able to use them with little or no modifications.
Usually, tests are located in the test and test/integration packages.
For example, if you’re looking for apimachinery tests, you can find them in the apimachinery/pkg/test package, or, if you’re looking for CRDs and CRs (CustomResourceDefinitions and CustomResources) definitions, you can find them in the apiextension-apiserver/test/integration package.
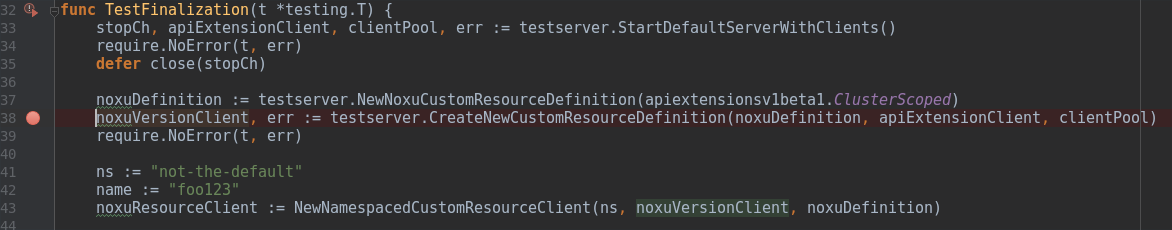
To demonstrate how this works, let’s tests how CustomResources with Finalizers are working, by using the TestFinalization test.
Using Debugger
Breakpoints are used to stop execution on the line you select (that line will not be executed). To put a breakpoint, click near the line number, and red dot will appear. For purposes of this post, let’s put it on the line 38 (CreateNewCustomResourceDefinition).
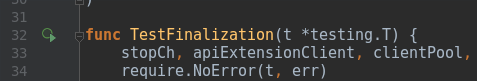
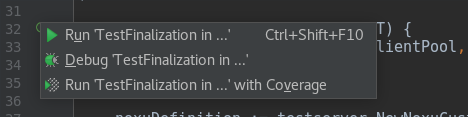
Now, run the debugger by clicking on the green dot, on the line 32.
That’s going to open a menu, where you need to choose Debug... to start the debugging journey.
After several seconds you’ll see debugger, which looks like this:
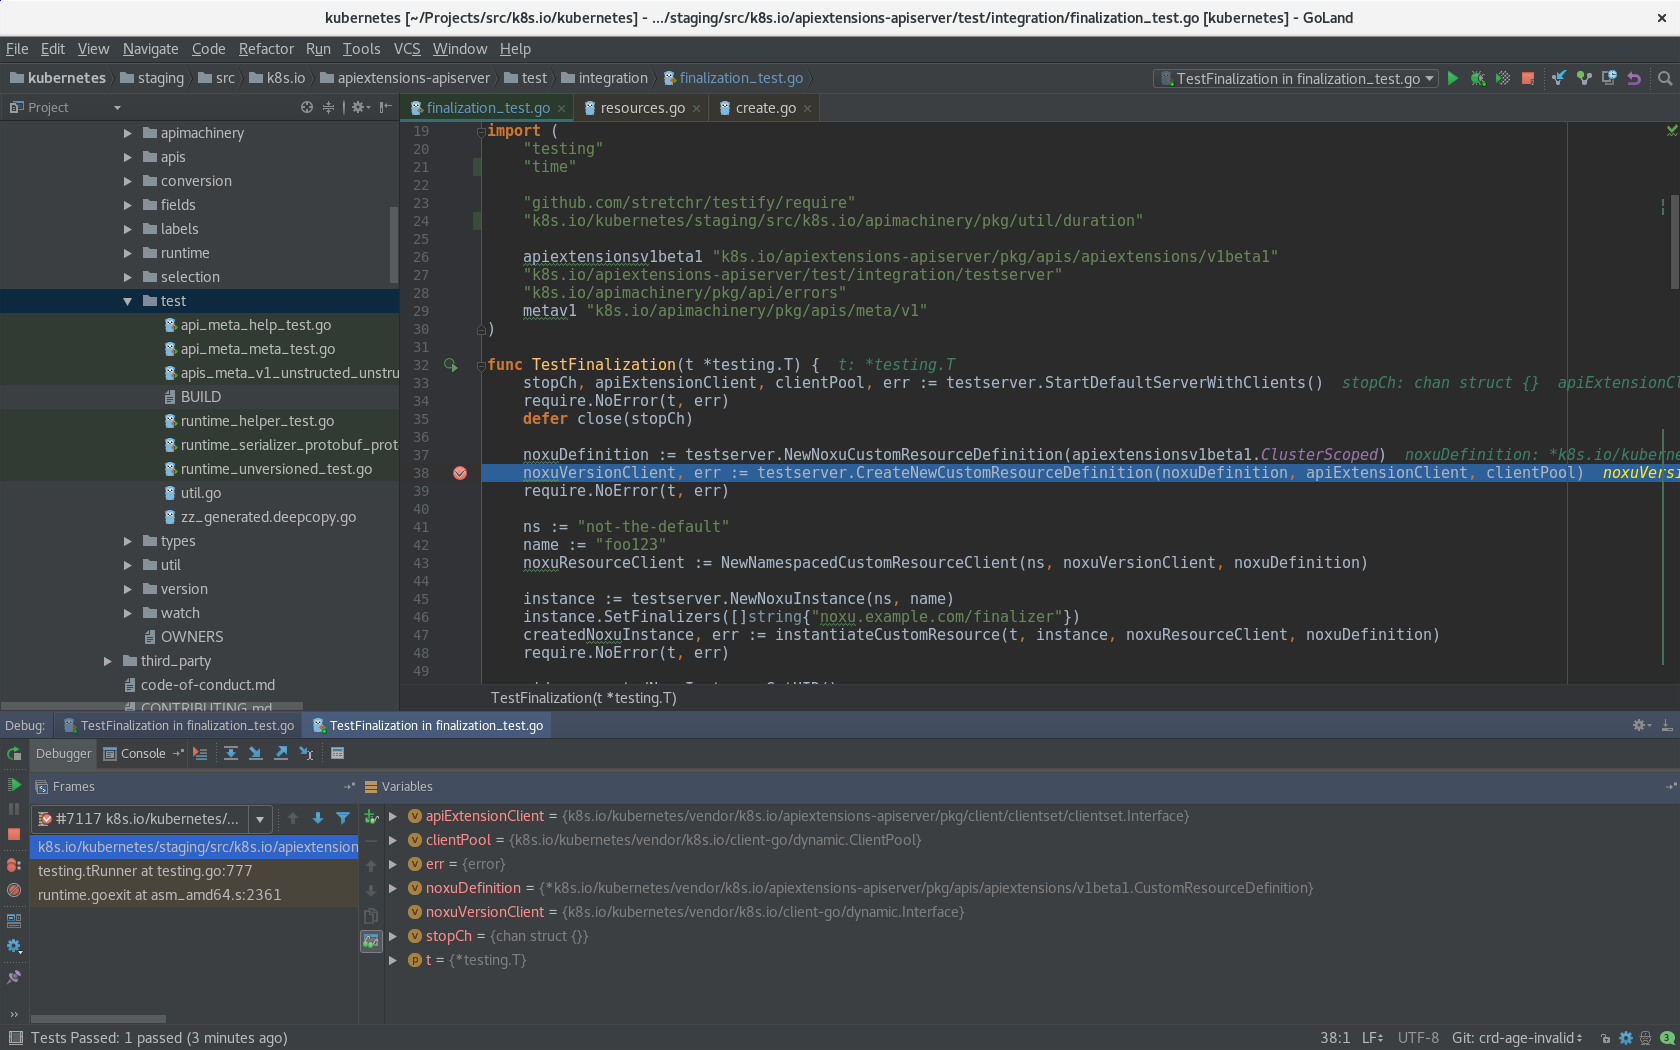
Here, you can observe your variables and their values. You can even change their values if you wish so.
Debugger has way more possibilities than just watching your variables. It can track what code is going to be executed next, via step functions, which are located in this row:

Here are the most important function:
* Step Over — steps to the next line in file you’re debugging (in our case this is line 39).
* Step Into — steps to the next line that are about to be executed (can be in any package, even in Go source!).
* Step Out — steps to the first line executed after returning from this method.
With those functions, your debugging journey will be much easier!
Putting Breakpoints
Now, let’s assume you have found where to put a breakpoint. But here arises a problem. You actually need to put a breakpoint in the appropriate file under the vendor directory.
For example, let’s say you want to put a breakpoint in a file located in the staging/src/k8s.io/apiextensions-apiserver package.
If you run debugger now, nothing is going to happen.
Let’s put it in the same file, but under the vendor directory, instead of staging. Run debugger, and.. it works!
What happened here?
The reason why this happens is that the k8s.io import paths are resolving to the appropriate subrepositories. For example, the k8s.io/apimachinery import path resolves to the kubernetes/apimachinery repository instead of to kubernetes/kubernetes repository and the staging directory. Therefore, if you don’t have kubernetes/apimachinery cloned locally, when you run tests, the code from the vendor directory is going to be used.
However, when you want to make changes, you should modify files in the staging directory, and not in the subrepositroies. When your Pull Request gets merged, your commits are also pushed from the staging directory to the appropriate subrepository, via publishing-bot.
Locally, all files from the staging directory are symbolic linked to the vendor directory, so you get all changes in the effect and you can test your code.
As breakpoints are not file changes, but actually telling IDE and debugger where to stop when code from a file gets executed, and you’re executing code from a file under the vendor directory, you need to put the breakpoint in the file in the vendor directory.
Debugging kubectl
Sometimes, you want debug kubectl, for example, you want to see what request it’s going to send, or how will it parse the response.
You can use kubectl tests, but it can be more practical to just put it in the debugger, and to provide it necessary flags and environment variables.
Running Local Kubernetes Cluster
To use kubectl you need to have working Kubernetes cluster. You can use any solution for this, but if you don’t already have one for testing, you can use the ./hack/local-up-cluster.sh script to set up a local single-node cluster.
This script requires you to have etcd in your PATH, so refer to the Setting Up Local etcd instance part of this post to set it up. The script also requires root privileges, so you’ll be asked to enter your sudo password.
Alternatively, you can use use Docker on Windows/Mac or run Kubernetes in the Cloud. You can also use tools such as kubicorn to set up a cluster on the cloud provider of your choice.
Creating Build Configurations
In order to run kubectl from GoLand, you need to create a build configuration. The build configuration explains how GoLand will run your program — it takes path to the file with main function, compiler flags, command-line arguments and more.
In the right corner of GoLand’s window, you have a dropdown box along with start, debug and stop buttons. Open the dropdown box and click on the Edit Configurations option.
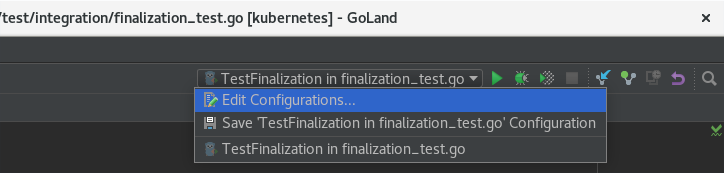
That will open a window, showing your current build configurations. Whenever you run something from GoLand (tests or builds), an appropriate build configuration is created, so you’ll probably already have several entries there.
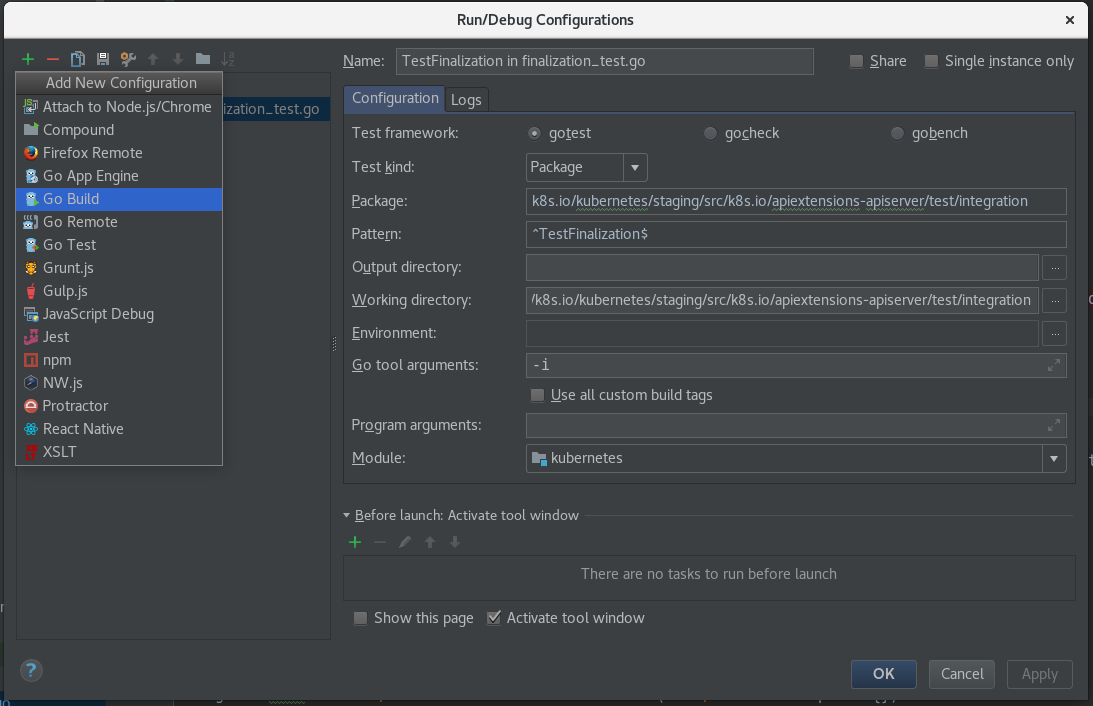
Click on the green + button and select Go Build option.
All kubectl-relevant code is located in the pkg/kubectl package. However, main function, used to run kubectl, is located in the cmd/kubectl directory (cmd/kubectl/kubectl.go).
In the File field, you need to provide path to the file with main function, in our case cmd/kubectl/kubectl.go. Output Directory is not required as GoLand handles it automatically.
Now, you need to provide a kubeconfig file and program arguments. The easiest way to provide a kubeconfig file, is to use the KUBECONFIG environment variable. If you’re running Kubernetes using the local-cluster-up.sh script, default kubeconfig location is /var/run/kubernetes/admin.kubeconfig.
In the Program arguments field add your kubectl arguments. For example, if you want to list all CRDs, you need to use get crd as an argument.
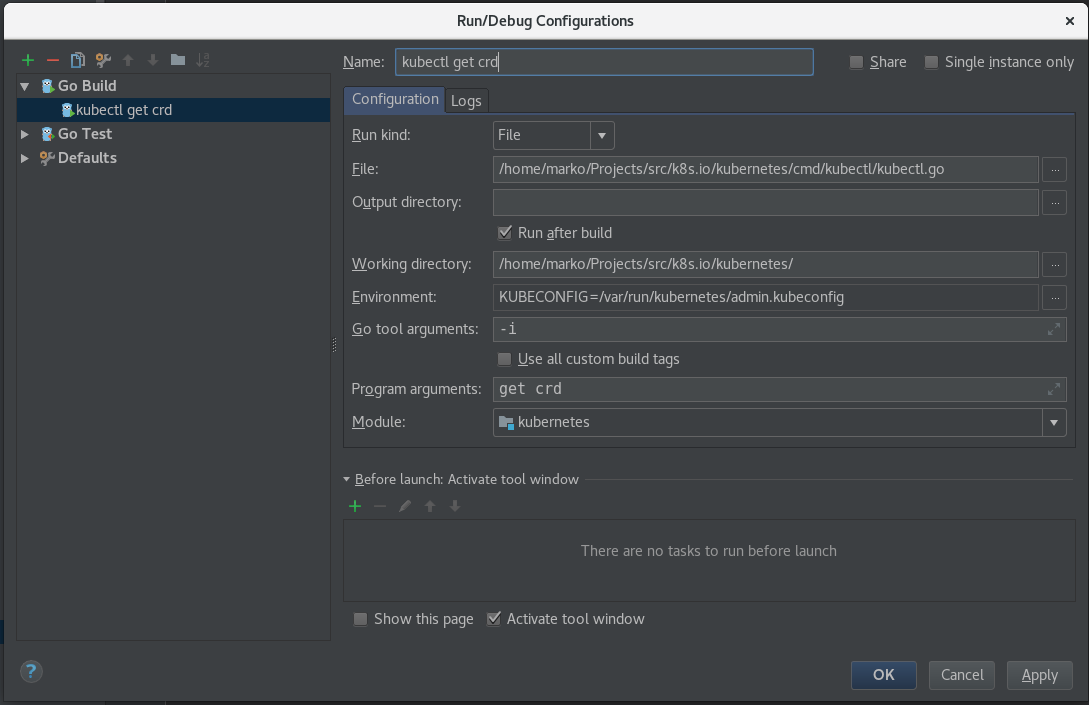
Once you’re done, click the OK button and using the button with bug image in the top right corner, run debugger with kubectl.
GoLand tips and tricks
Now that you know how to debug and where to put your breakpoints, I would mention this two tricks that saved me a lot of time.
- In order to see function’s implementation, you can just press your
CTRLkey (should becmdon macOS) and then click on the function. That navigates you to the function’s implementation. - If you want to see all your breakpoints, press
CTRL+SHIFT+F8. There you can list all breakpoints and even disable or delete them if you don’t need them anymore. Double-clicking on that breakpoint will navigate you to the file where it is put.
Conclusion
I hope this post helped you to learn how to debug Kubernetes API calls and kubectl. If you have any additional questions or suggestions, please send them to me on Twitter or on Kubernetes Slack (@xmudrii).